


The 2024 Health Equity Index (formerly SocioNeeds Index), created by Conduent Healthy Communities Institute, is a measure of socioeconomic need that is correlated with poor health outcomes. The index is part of Conduent's SocioNeeds Index® Suite, which provides analytics around social determinants of health to advance equitable outcomes for a range of topics.
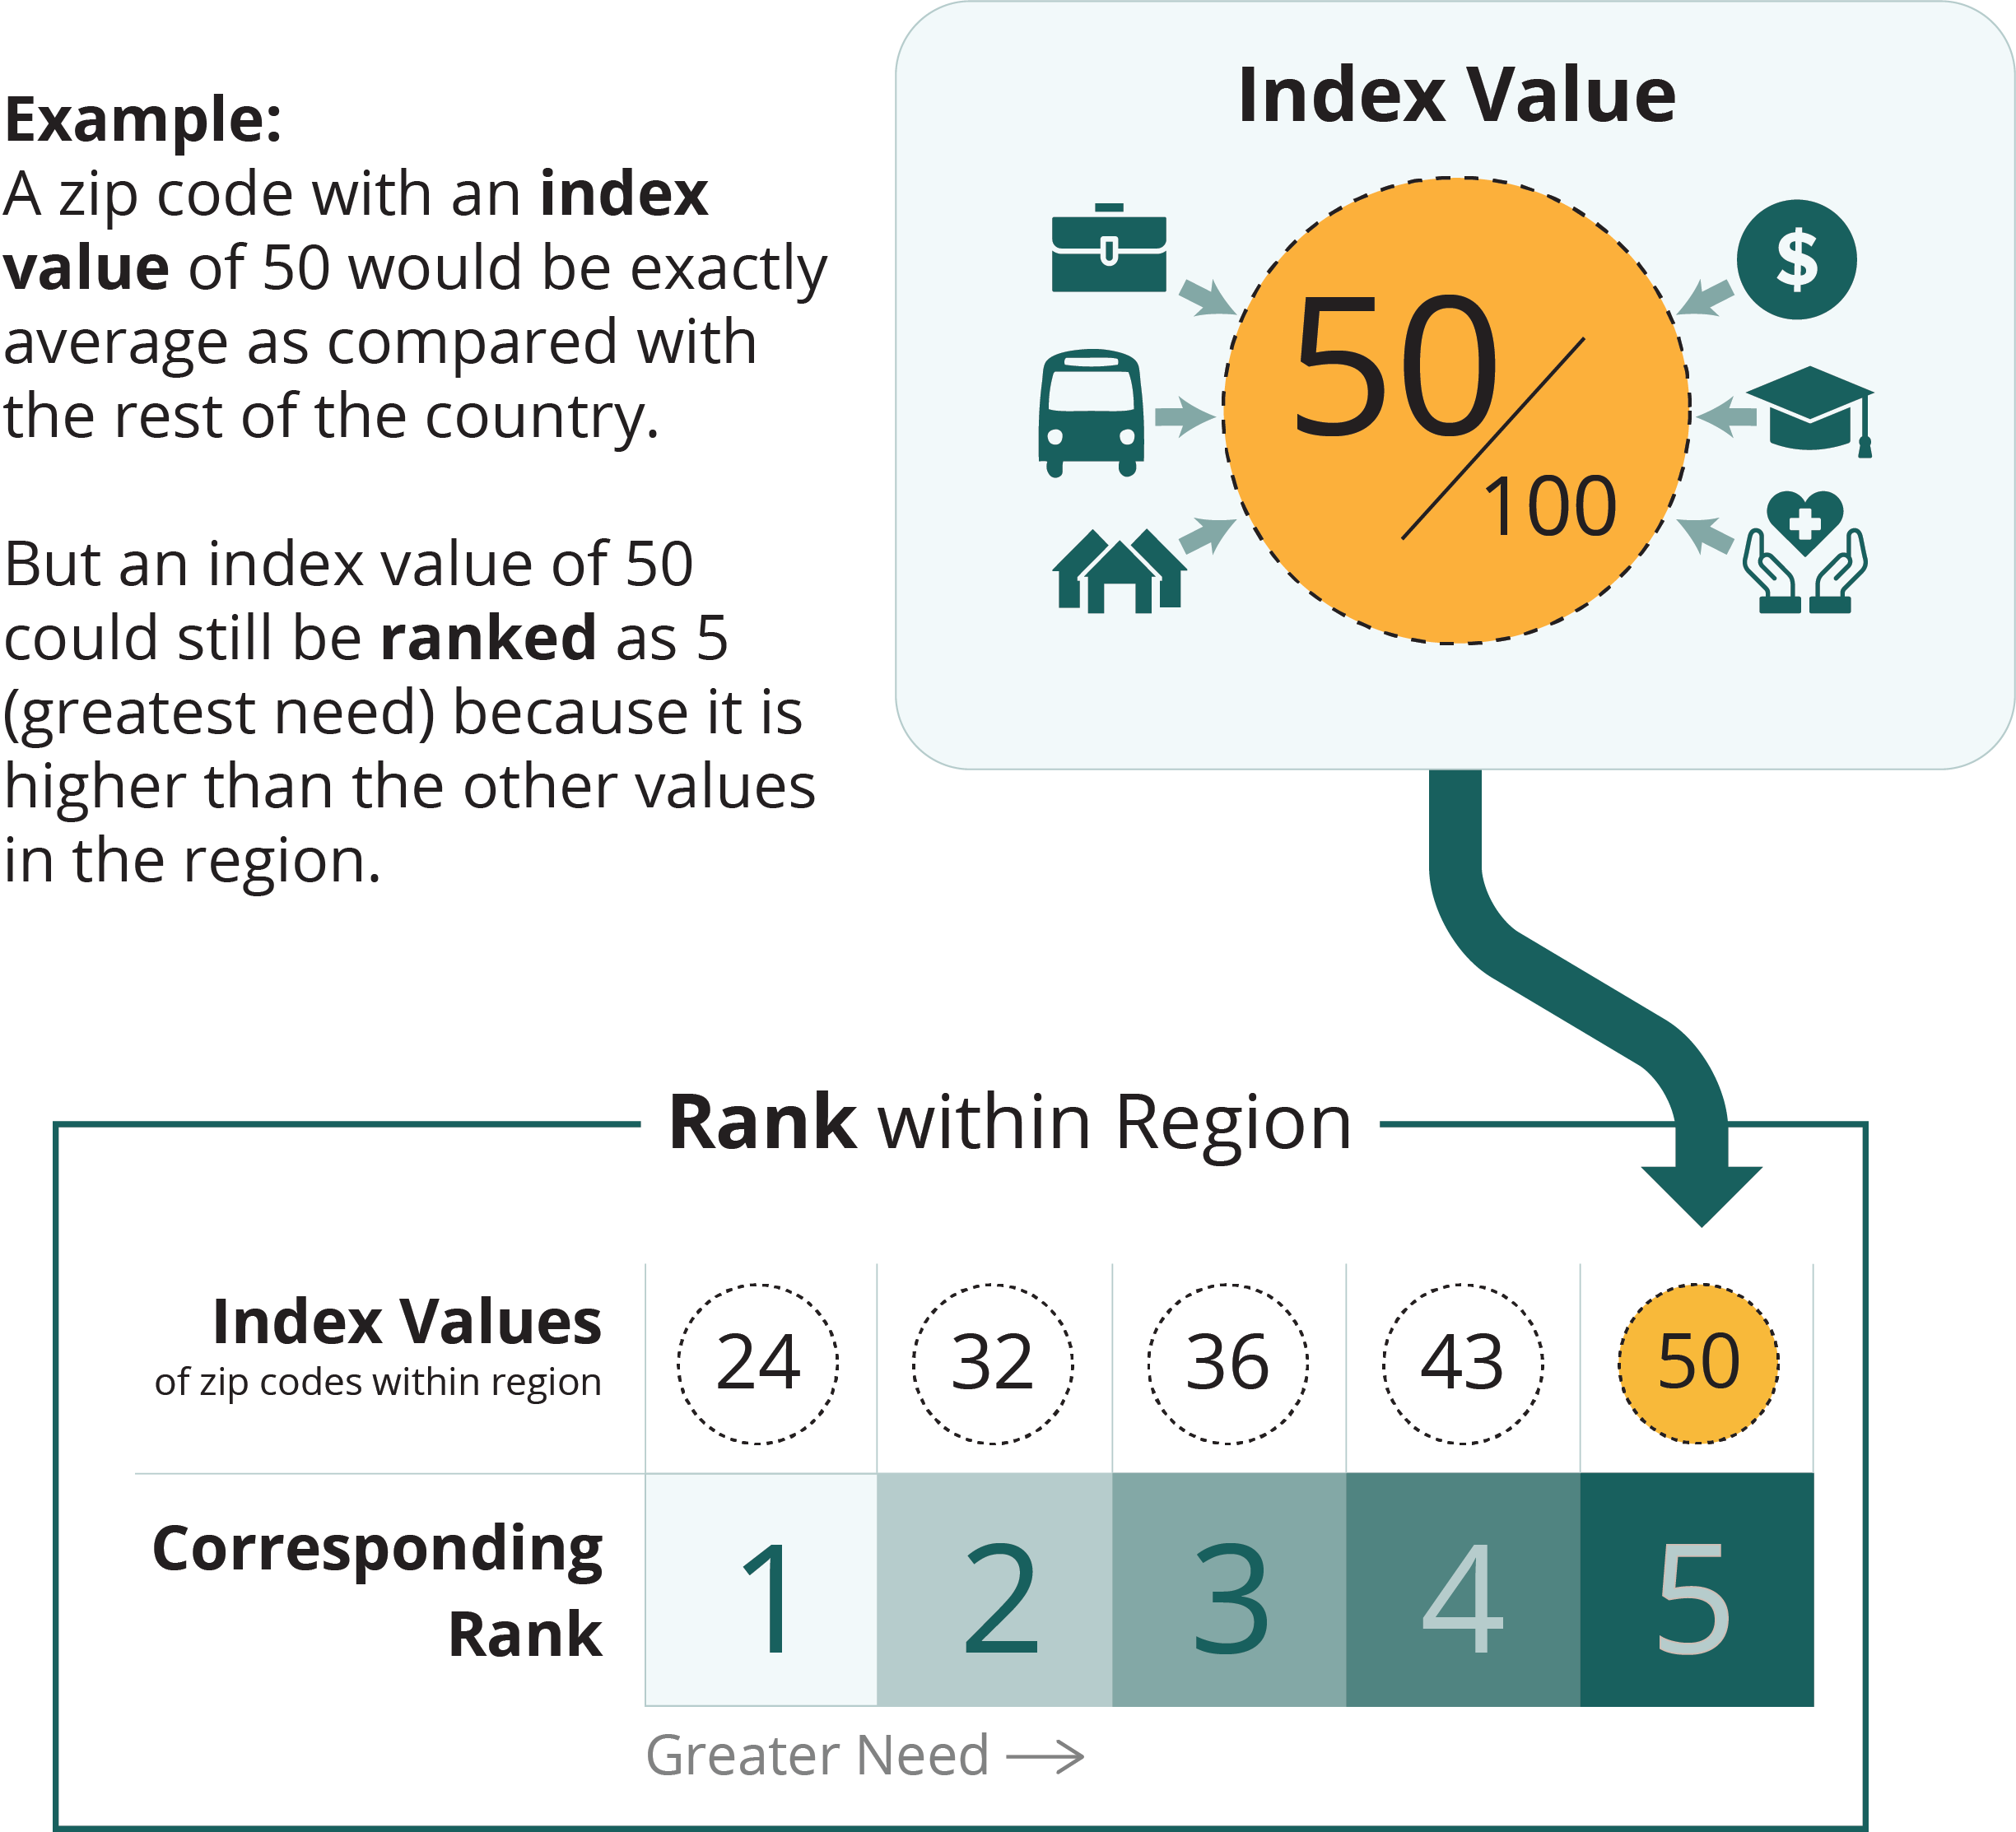
All zip codes, counties, and county equivalents in the United States are given an index value from 0 (low need) to 100 (high need). To help you find the areas of highest need in your community, the selected locations are ranked from 1 (low need) to 5 (high need) based on their index value relative to similar locations within the region.
The selected location is not available for mapping. This may be due to changes to the definitions of Zip Codes and other geographies over time.

Single geographies are not ranked
greater need


| Countysort column | Indexsort column | Ranksort column | Pop.sort column |
|---|---|---|---|
| Clark | 67.5 | N/A | 2,368,484 |
| Zip Codesort column | Indexsort column | Ranksort column | Pop.sort column | Countysort column |
|---|---|---|---|---|
| 89030 | 99.0 | 5 | 56,805 | Clark |
| 89115 | 99.0 | 5 | 68,926 | Clark |
| 89101 | 98.7 | 5 | 43,041 | Clark |
| 89109 | 97.8 | 5 | 7,634 | Clark |
| 89106 | 97.6 | 5 | 28,562 | Clark |
| 89102 | 95.2 | 5 | 36,675 | Clark |
| 89029 | 94.8 | 5 | 9,407 | Clark |
| 89104 | 94.6 | 5 | 41,213 | Clark |
| 89110 | 94.5 | 5 | 76,330 | Clark |
| 89169 | 93.4 | 5 | 27,302 | Clark |
| 89040 | 92.7 | 5 | 4,604 | Clark |
| 89121 | 91.8 | 5 | 69,768 | Clark |
| 89108 | 91.5 | 5 | 75,578 | Clark |
| 89119 | 91.1 | 5 | 50,342 | Clark |
| 89086 | 90.8 | 5 | 8,186 | Clark |
| 89021 | 89.7 | 5 | 3,393 | Clark |
| 89034 | 87.4 | 5 | 3,258 | Clark |
| 89018 | 86.2 | 5 | 6,224 | Clark |
| 89103 | 85.9 | 5 | 48,726 | Clark |
| 89156 | 85.3 | 5 | 30,572 | Clark |
| 89015 | 84.4 | 5 | 42,677 | Clark |
| 89032 | 84.3 | 5 | 49,735 | Clark |
| 89146 | 83.9 | 5 | 19,518 | Clark |
| 89122 | 83.4 | 5 | 59,128 | Clark |
| 89107 | 82.2 | 5 | 38,535 | Clark |
| 89142 | 80.8 | 5 | 36,101 | Clark |
| 89046 | 79.4 | 5 | 516 | Clark |
| 89019 | 77.3 | 4 | 2,777 | Clark |
| 89027 | 71.2 | 4 | 19,033 | Clark |
| 89117 | 68.4 | 4 | 58,276 | Clark |
| 89143 | 67.9 | 4 | 13,768 | Clark |
| 89081 | 67.4 | 4 | 44,022 | Clark |
| 89005 | 64.6 | 4 | 15,124 | Clark |
| 89120 | 62.1 | 4 | 25,352 | Clark |
| 89031 | 61.5 | 4 | 77,633 | Clark |
| 89130 | 60.2 | 4 | 33,339 | Clark |
| 89113 | 54.6 | 3 | 38,418 | Clark |
| 89085 | 54.1 | 3 | 4,195 | Clark |
| 89123 | 54.1 | 3 | 57,426 | Clark |
| 89147 | 53.9 | 3 | 57,073 | Clark |
| 89134 | 50.7 | 3 | 24,292 | Clark |
| 89007 | 47.8 | 3 | 621 | Clark |
| 89084 | 47.6 | 3 | 35,964 | Clark |
| 89145 | 47.3 | 3 | 26,335 | Clark |
| 89148 | 46.9 | 3 | 66,852 | Clark |
| 89128 | 44.7 | 3 | 39,163 | Clark |
| 89124 | 44.4 | 3 | 943 | Clark |
| 89183 | 43.1 | 3 | 41,753 | Clark |
| 89118 | 40.1 | 2 | 25,376 | Clark |
| 89139 | 38.5 | 2 | 47,040 | Clark |
| 89129 | 38.2 | 2 | 55,429 | Clark |
| 89011 | 37.3 | 2 | 38,800 | Clark |
| 89002 | 36.7 | 2 | 38,809 | Clark |
| 89014 | 36.2 | 2 | 41,453 | Clark |
| 89012 | 34.0 | 2 | 37,748 | Clark |
| 89074 | 33.6 | 2 | 53,808 | Clark |
| 89052 | 30.0 | 2 | 63,732 | Clark |
| 89179 | 29.9 | 2 | 12,981 | Clark |
| 89149 | 29.5 | 2 | 45,043 | Clark |
| 89141 | 28.7 | 2 | 42,664 | Clark |
| 89178 | 26.4 | 2 | 45,552 | Clark |
| 89131 | 25.2 | 2 | 51,128 | Clark |
| 89158 | 19.6 | 1 | 585 | Clark |
| 89161 | 18.4 | 1 | 1,205 | Clark |
| 89166 | 17.9 | 1 | 29,355 | Clark |
| 89044 | 14.6 | 1 | 32,879 | Clark |
| 89144 | 14.4 | 1 | 19,831 | Clark |
| 89135 | 13.3 | 1 | 34,494 | Clark |
| 89138 | 2.7 | 1 | 24,329 | Clark |
| Census Tractsort column | Indexsort column | Ranksort column | Pop.sort column | Countysort column |
|---|---|---|---|---|
| 32003000401 | 99.7 | 5 | Clark | |
| 32003001614 | 99.7 | 5 | Clark | |
| 32003000522 | 99.5 | 5 | Clark | |
| 32003006001 | 99.3 | 5 | Clark | |
| 32003004710 | 99.2 | 5 | Clark | |
| 32003000521 | 99.0 | 5 | Clark | |
| 32003004602 | 99.0 | 5 | Clark | |
| 32003000302 | 98.9 | 5 | Clark | |
| 32003004707 | 98.8 | 5 | Clark | |
| 32003004712 | 98.8 | 5 | Clark | |
| 32003004301 | 98.7 | 5 | Clark | |
| 32003004302 | 98.7 | 5 | Clark | |
| 32003007100 | 98.7 | 5 | Clark | |
| 32003004200 | 98.6 | 5 | Clark | |
| 32003000519 | 98.5 | 5 | Clark | |
| 32003002207 | 98.5 | 5 | Clark | |
| 32003004402 | 98.4 | 5 | Clark | |
| 32003004703 | 98.2 | 5 | Clark | |
| 32003004000 | 98.1 | 5 | Clark | |
| 32003004401 | 98.1 | 5 | Clark | |
| 32003000524 | 98.0 | 5 | Clark | |
| 32003002997 | 98.0 | 5 | Clark | |
| 32003004500 | 98.0 | 5 | Clark | |
| 32003000402 | 97.9 | 5 | Clark | |
| 32003001608 | 97.9 | 5 | Clark | |
| 32003002000 | 97.9 | 5 | Clark | |
| 32003000301 | 97.8 | 5 | Clark | |
| 32003003800 | 97.8 | 5 | Clark | |
| 32003000600 | 97.7 | 5 | Clark | |
| 32003002203 | 97.3 | 5 | Clark | |
| 32003003616 | 97.3 | 5 | Clark | |
| 32003004709 | 97.3 | 5 | Clark | |
| 32003003429 | 97.1 | 5 | Clark | |
| 32003003500 | 96.8 | 5 | Clark | |
| 32003001718 | 96.7 | 5 | Clark | |
| 32003000525 | 96.5 | 5 | Clark | |
| 32003003214 | 96.4 | 5 | Clark | |
| 32003004601 | 96.3 | 5 | Clark | |
| 32003000523 | 96.2 | 5 | Clark | |
| 32003002204 | 96.1 | 5 | Clark | |
| 32003002954 | 96.1 | 5 | Clark | |
| 32003000526 | 96.0 | 5 | Clark | |
| 32003002404 | 96.0 | 5 | Clark | |
| 32003000528 | 95.9 | 5 | Clark | |
| 32003000403 | 95.8 | 5 | Clark | |
| 32003001607 | 95.8 | 5 | Clark | |
| 32003001710 | 95.7 | 5 | Clark | |
| 32003003423 | 95.6 | 5 | Clark | |
| 32003003700 | 95.5 | 5 | Clark | |
| 32003000510 | 95.3 | 5 | Clark | |
| 32003003428 | 95.3 | 5 | Clark | |
| 32003000514 | 95.2 | 5 | Clark | |
| 32003005702 | 95.2 | 5 | Clark | |
| 32003004717 | 95.1 | 5 | Clark | |
| 32003005876 | 95.1 | 5 | Clark | |
| 32003001401 | 95.0 | 5 | Clark | |
| 32003004714 | 95.0 | 5 | Clark | |
| 32003002708 | 94.9 | 5 | Clark | |
| 32003002937 | 94.9 | 5 | Clark | |
| 32003004920 | 94.9 | 5 | Clark | |
| 32003000518 | 94.7 | 5 | Clark | |
| 32003001501 | 94.7 | 5 | Clark | |
| 32003000527 | 94.6 | 5 | Clark | |
| 32003003617 | 94.6 | 5 | Clark | |
| 32003000108 | 94.5 | 5 | Clark | |
| 32003000516 | 94.4 | 5 | Clark | |
| 32003001100 | 94.3 | 5 | Clark | |
| 32003000513 | 94.2 | 5 | Clark | |
| 32003005114 | 94.2 | 5 | Clark | |
| 32003005006 | 94.1 | 5 | Clark | |
| 32003004713 | 94.0 | 5 | Clark | |
| 32003005613 | 93.9 | 5 | Clark | |
| 32003001902 | 93.6 | 5 | Clark | |
| 32003005421 | 93.5 | 5 | Clark | |
| 32003002604 | 93.4 | 5 | Clark | |
| 32003007801 | 93.1 | 5 | Clark | |
| 32003005010 | 93.0 | 5 | Clark | |
| 32003004916 | 92.9 | 5 | Clark | |
| 32003002201 | 92.8 | 5 | Clark | |
| 32003004100 | 92.7 | 5 | Clark | |
| 32003001803 | 92.6 | 5 | Clark | |
| 32003005005 | 92.6 | 5 | Clark | |
| 32003006800 | 92.6 | 5 | Clark | |
| 32003001717 | 92.5 | 5 | Clark | |
| 32003002506 | 92.5 | 5 | Clark | |
| 32003002824 | 92.4 | 5 | Clark | |
| 32003005504 | 92.4 | 5 | Clark | |
| 32003001200 | 92.3 | 5 | Clark | |
| 32003001502 | 92.3 | 5 | Clark | |
| 32003002706 | 92.3 | 5 | Clark | |
| 32003005012 | 92.3 | 5 | Clark | |
| 32003005704 | 92.2 | 5 | Clark | |
| 32003000517 | 92.0 | 5 | Clark | |
| 32003002403 | 92.0 | 5 | Clark | |
| 32003002206 | 91.9 | 5 | Clark | |
| 32003007200 | 91.9 | 5 | Clark | |
| 32003002504 | 91.8 | 5 | Clark | |
| 32003003649 | 91.8 | 5 | Clark | |
| 32003003656 | 91.8 | 5 | Clark | |
| 32003000520 | 91.7 | 5 | Clark | |
| 32003001615 | 91.7 | 5 | Clark | |
| 32003005722 | 91.7 | 5 | Clark | |
| 32003005857 | 91.7 | 5 | Clark | |
| 32003000515 | 91.4 | 5 | Clark | |
| 32003006202 | 91.4 | 5 | Clark | |
| 32003003648 | 91.2 | 5 | Clark | |
| 32003001716 | 91.1 | 5 | Clark | |
| 32003004716 | 91.1 | 5 | Clark | |
| 32003000201 | 91.0 | 5 | Clark | |
| 32003001402 | 90.8 | 5 | Clark | |
| 32003001715 | 90.8 | 5 | Clark | |
| 32003001300 | 90.6 | 5 | Clark | |
| 32003005615 | 90.6 | 5 | Clark | |
| 32003002406 | 90.4 | 5 | Clark | |
| 32003003413 | 90.2 | 5 | Clark | |
| 32003003643 | 90.1 | 5 | Clark | |
| 32003002966 | 90.0 | 5 | Clark | |
| 32003005336 | 90.0 | 5 | Clark | |
| 32003005200 | 89.9 | 5 | Clark | |
| 32003002996 | 89.5 | 5 | Clark | |
| 32003005434 | 89.5 | 5 | Clark | |
| 32003003422 | 89.4 | 5 | Clark | |
| 32003002847 | 89.2 | 5 | Clark | |
| 32003003260 | 89.1 | 5 | Clark | |
| 32003002946 | 88.9 | 5 | Clark | |
| 32003000105 | 88.8 | 5 | Clark | |
| 32003003415 | 88.8 | 5 | Clark | |
| 32003005809 | 88.6 | 5 | Clark | |
| 32003005612 | 88.2 | 5 | Clark | |
| 32003003104 | 88.1 | 5 | Clark | |
| 32003002941 | 87.7 | 5 | Clark | |
| 32003003663 | 87.7 | 5 | Clark | |
| 32003005705 | 87.6 | 5 | Clark | |
| 32003003431 | 87.4 | 5 | Clark | |
| 32003003320 | 87.3 | 5 | Clark | |
| 32003000203 | 86.9 | 5 | Clark | |
| 32003004911 | 86.9 | 5 | Clark | |
| 32003005902 | 86.8 | 5 | Clark | |
| 32003002962 | 86.3 | 5 | Clark | |
| 32003004915 | 86.3 | 5 | Clark | |
| 32003003430 | 86.2 | 5 | Clark | |
| 32003005905 | 86.2 | 5 | Clark | |
| 32003005355 | 86.1 | 5 | Clark | |
| 32003007900 | 85.9 | 5 | Clark | |
| 32003000700 | 85.8 | 5 | Clark | |
| 32003001609 | 85.8 | 5 | Clark | |
| 32003000106 | 85.6 | 5 | Clark | |
| 32003003001 | 85.6 | 5 | Clark | |
| 32003004715 | 85.6 | 5 | Clark | |
| 32003005360 | 85.4 | 5 | Clark | |
| 32003005107 | 85.3 | 5 | Clark | |
| 32003005904 | 85.1 | 5 | Clark | |
| 32003003427 | 85.0 | 5 | Clark | |
| 32003003627 | 84.8 | 5 | Clark | |
| 32003003644 | 84.8 | 5 | Clark | |
| 32003002965 | 84.6 | 5 | Clark | |
| 32003005855 | 84.3 | 5 | Clark | |
| 32003002905 | 84.2 | 5 | Clark | |
| 32003005848 | 84.2 | 5 | Clark | |
| 32003004910 | 84.0 | 5 | Clark | |
| 32003002405 | 83.9 | 5 | Clark | |
| 32003002976 | 83.9 | 5 | Clark | |
| 32003002948 | 83.8 | 5 | Clark | |
| 32003004912 | 83.8 | 5 | Clark | |
| 32003003609 | 83.4 | 4 | Clark | |
| 32003005363 | 83.4 | 4 | Clark | |
| 32003001714 | 83.2 | 4 | Clark | |
| 32003004918 | 82.9 | 4 | Clark | |
| 32003004926 | 82.9 | 4 | Clark | |
| 32003002826 | 82.7 | 4 | Clark | |
| 32003002837 | 82.7 | 4 | Clark | |
| 32003002707 | 82.6 | 4 | Clark | |
| 32003002814 | 82.6 | 4 | Clark | |
| 32003002981 | 82.6 | 4 | Clark | |
| 32003001005 | 82.2 | 4 | Clark | |
| 32003002942 | 81.8 | 4 | Clark | |
| 32003002957 | 81.5 | 4 | Clark | |
| 32003001712 | 81.3 | 4 | Clark | |
| 32003001901 | 81.3 | 4 | Clark | |
| 32003003661 | 81.2 | 4 | Clark | |
| 32003003655 | 81.0 | 4 | Clark | |
| 32003001613 | 80.9 | 4 | Clark | |
| 32003005607 | 80.8 | 4 | Clark | |
| 32003002303 | 80.7 | 4 | Clark | |
| 32003002830 | 80.4 | 4 | Clark | |
| 32003002935 | 80.4 | 4 | Clark | |
| 32003005110 | 80.4 | 4 | Clark | |
| 32003005818 | 80.2 | 4 | Clark | |
| 32003000109 | 80.0 | 4 | Clark | |
| 32003002998 | 80.0 | 4 | Clark | |
| 32003005438 | 80.0 | 4 | Clark | |
| 32003005011 | 79.7 | 4 | Clark | |
| 32003003419 | 79.2 | 4 | Clark | |
| 32003002603 | 79.1 | 4 | Clark | |
| 32003002940 | 79.1 | 4 | Clark | |
| 32003001610 | 79.0 | 4 | Clark | |
| 32003002838 | 79.0 | 4 | Clark | |
| 32003003262 | 78.9 | 4 | Clark | |
| 32003005432 | 78.8 | 4 | Clark | |
| 32003002938 | 78.7 | 4 | Clark | |
| 32003003305 | 78.7 | 4 | Clark | |
| 32003005116 | 78.7 | 4 | Clark | |
| 32003003245 | 78.6 | 4 | Clark | |
| 32003000101 | 78.3 | 4 | Clark | |
| 32003003316 | 78.3 | 4 | Clark | |
| 32003003630 | 78.2 | 4 | Clark | |
| 32003005423 | 78.1 | 4 | Clark | |
| 32003001804 | 78.0 | 4 | Clark | |
| 32003006900 | 77.9 | 4 | Clark | |
| 32003002849 | 77.8 | 4 | Clark | |
| 32003002501 | 77.7 | 4 | Clark | |
| 32003005803 | 77.5 | 4 | Clark | |
| 32003004923 | 77.2 | 4 | Clark | |
| 32003001711 | 77.0 | 4 | Clark | |
| 32003003653 | 76.9 | 4 | Clark | |
| 32003003621 | 76.6 | 4 | Clark | |
| 32003003645 | 76.6 | 4 | Clark | |
| 32003001706 | 76.5 | 4 | Clark | |
| 32003003420 | 76.5 | 4 | Clark | |
| 32003001713 | 76.2 | 4 | Clark | |
| 32003003261 | 76.2 | 4 | Clark | |
| 32003002845 | 76.1 | 4 | Clark | |
| 32003002982 | 76.1 | 4 | Clark | |
| 32003001006 | 75.8 | 4 | Clark | |
| 32003003317 | 75.7 | 4 | Clark | |
| 32003003636 | 75.7 | 4 | Clark | |
| 32003004921 | 75.6 | 4 | Clark | |
| 32003005422 | 75.4 | 4 | Clark | |
| 32003003409 | 75.2 | 4 | Clark | |
| 32003006204 | 74.8 | 4 | Clark | |
| 32003002822 | 74.6 | 4 | Clark | |
| 32003002968 | 74.2 | 4 | Clark | |
| 32003003219 | 74.0 | 4 | Clark | |
| 32003003412 | 74.0 | 4 | Clark | |
| 32003004924 | 73.9 | 4 | Clark | |
| 32003005721 | 73.9 | 4 | Clark | |
| 32003002967 | 73.7 | 4 | Clark | |
| 32003002936 | 73.5 | 4 | Clark | |
| 32003003619 | 73.2 | 4 | Clark | |
| 32003003639 | 73.2 | 4 | Clark | |
| 32003003102 | 73.1 | 4 | Clark | |
| 32003003253 | 72.9 | 4 | Clark | |
| 32003002302 | 72.8 | 4 | Clark | |
| 32003002829 | 72.7 | 4 | Clark | |
| 32003002915 | 72.6 | 4 | Clark | |
| 32003003243 | 72.5 | 4 | Clark | |
| 32003003248 | 72.5 | 4 | Clark | |
| 32003005115 | 71.6 | 4 | Clark | |
| 32003002970 | 71.4 | 4 | Clark | |
| 32003005870 | 71.3 | 4 | Clark | |
| 32003005335 | 71.0 | 4 | Clark | |
| 32003006203 | 70.7 | 4 | Clark | |
| 32003001801 | 70.5 | 4 | Clark | |
| 32003002823 | 69.6 | 4 | Clark | |
| 32003006201 | 69.6 | 4 | Clark | |
| 32003003213 | 69.5 | 4 | Clark | |
| 32003003651 | 68.9 | 4 | Clark | |
| 32003005017 | 68.9 | 4 | Clark | |
| 32003001611 | 68.8 | 4 | Clark | |
| 32003005808 | 68.8 | 4 | Clark | |
| 32003002846 | 68.7 | 4 | Clark | |
| 32003005341 | 68.6 | 4 | Clark | |
| 32003002950 | 68.5 | 4 | Clark | |
| 32003003666 | 68.4 | 4 | Clark | |
| 32003003613 | 67.9 | 4 | Clark | |
| 32003001004 | 67.8 | 4 | Clark | |
| 32003003414 | 67.7 | 4 | Clark | |
| 32003003657 | 67.6 | 4 | Clark | |
| 32003005347 | 67.6 | 4 | Clark | |
| 32003003307 | 66.4 | 4 | Clark | |
| 32003002939 | 66.2 | 4 | Clark | |
| 32003005016 | 65.9 | 4 | Clark | |
| 32003000103 | 65.8 | 4 | Clark | |
| 32003002985 | 65.8 | 4 | Clark | |
| 32003003418 | 65.8 | 4 | Clark | |
| 32003005337 | 65.8 | 4 | Clark | |
| 32003005830 | 65.6 | 4 | Clark | |
| 32003002505 | 65.4 | 4 | Clark | |
| 32003003641 | 65.3 | 4 | Clark | |
| 32003005869 | 65.3 | 4 | Clark | |
| 32003003421 | 65.1 | 4 | Clark | |
| 32003002964 | 65.0 | 4 | Clark | |
| 32003005014 | 65.0 | 4 | Clark | |
| 32003005837 | 64.8 | 4 | Clark | |
| 32003003426 | 64.2 | 4 | Clark | |
| 32003005503 | 64.2 | 4 | Clark | |
| 32003005439 | 63.8 | 3 | Clark | |
| 32003003634 | 63.6 | 3 | Clark | |
| 32003003210 | 63.1 | 3 | Clark | |
| 32003005013 | 63.1 | 3 | Clark | |
| 32003002842 | 62.8 | 3 | Clark | |
| 32003003240 | 62.7 | 3 | Clark | |
| 32003003646 | 62.4 | 3 | Clark | |
| 32003004925 | 61.9 | 3 | Clark | |
| 32003003252 | 61.7 | 3 | Clark | |
| 32003003410 | 61.5 | 3 | Clark | |
| 32003003638 | 61.4 | 3 | Clark | |
| 32003005862 | 61.3 | 3 | Clark | |
| 32003004919 | 61.0 | 3 | Clark | |
| 32003002974 | 60.8 | 3 | Clark | |
| 32003003662 | 60.8 | 3 | Clark | |
| 32003003610 | 60.6 | 3 | Clark | |
| 32003003635 | 60.4 | 3 | Clark | |
| 32003003306 | 60.3 | 3 | Clark | |
| 32003005311 | 60.2 | 3 | Clark | |
| 32003003269 | 60.0 | 3 | Clark | |
| 32003001707 | 59.9 | 3 | Clark | |
| 32003005007 | 59.8 | 3 | Clark | |
| 32003005849 | 59.8 | 3 | Clark | |
| 32003003246 | 59.6 | 3 | Clark | |
| 32003005850 | 59.6 | 3 | Clark | |
| 32003003637 | 59.0 | 3 | Clark | |
| 32003005825 | 59.0 | 3 | Clark | |
| 32003003233 | 58.9 | 3 | Clark | |
| 32003005847 | 58.8 | 3 | Clark | |
| 32003005716 | 58.4 | 3 | Clark | |
| 32003002808 | 58.3 | 3 | Clark | |
| 32003005865 | 57.8 | 3 | Clark | |
| 32003002919 | 57.0 | 3 | Clark | |
| 32003003309 | 56.8 | 3 | Clark | |
| 32003002995 | 56.3 | 3 | Clark | |
| 32003005353 | 56.2 | 3 | Clark | |
| 32003003234 | 55.5 | 3 | Clark | |
| 32003005320 | 55.2 | 3 | Clark | |
| 32003005868 | 54.7 | 3 | Clark | |
| 32003001003 | 54.6 | 3 | Clark | |
| 32003003318 | 54.6 | 3 | Clark | |
| 32003005354 | 54.6 | 3 | Clark | |
| 32003005108 | 54.4 | 3 | Clark | |
| 32003003633 | 54.3 | 3 | Clark | |
| 32003003650 | 54.3 | 3 | Clark | |
| 32003005856 | 54.2 | 3 | Clark | |
| 32003003626 | 54.1 | 3 | Clark | |
| 32003003654 | 54.0 | 3 | Clark | |
| 32003003303 | 53.9 | 3 | Clark | |
| 32003002953 | 53.7 | 3 | Clark | |
| 32003003640 | 53.7 | 3 | Clark | |
| 32003004917 | 53.7 | 3 | Clark | |
| 32003003315 | 53.5 | 3 | Clark | |
| 32003005015 | 53.4 | 3 | Clark | |
| 32003002969 | 53.2 | 3 | Clark | |
| 32003004914 | 53.2 | 3 | Clark | |
| 32003005903 | 52.9 | 3 | Clark | |
| 32003002980 | 52.2 | 3 | Clark | |
| 32003003416 | 51.9 | 3 | Clark | |
| 32003003647 | 51.9 | 3 | Clark | |
| 32003005502 | 51.2 | 3 | Clark | |
| 32003005807 | 51.1 | 3 | Clark | |
| 32003002944 | 50.9 | 3 | Clark | |
| 32003003631 | 50.8 | 3 | Clark | |
| 32003001709 | 50.5 | 3 | Clark | |
| 32003007500 | 50.5 | 3 | Clark | |
| 32003003005 | 50.4 | 3 | Clark | |
| 32003003263 | 50.4 | 3 | Clark | |
| 32003002978 | 49.9 | 3 | Clark | |
| 32003007600 | 49.8 | 3 | Clark | |
| 32003005111 | 49.7 | 3 | Clark | |
| 32003005718 | 49.4 | 3 | Clark | |
| 32003003241 | 49.1 | 3 | Clark | |
| 32003005614 | 49.0 | 3 | Clark | |
| 32003003247 | 48.8 | 3 | Clark | |
| 32003002851 | 48.7 | 3 | Clark | |
| 32003005351 | 48.5 | 3 | Clark | |
| 32003002811 | 48.2 | 3 | Clark | |
| 32003003270 | 48.2 | 3 | Clark | |
| 32003005433 | 48.1 | 3 | Clark | |
| 32003003659 | 47.8 | 3 | Clark | |
| 32003002825 | 47.6 | 3 | Clark | |
| 32003005314 | 47.6 | 3 | Clark | |
| 32003003103 | 47.5 | 3 | Clark | |
| 32003003254 | 47.5 | 3 | Clark | |
| 32003003239 | 47.3 | 3 | Clark | |
| 32003005863 | 47.1 | 3 | Clark | |
| 32003003204 | 46.5 | 3 | Clark | |
| 32003005343 | 46.3 | 3 | Clark | |
| 32003003665 | 46.1 | 3 | Clark | |
| 32003005321 | 46.0 | 3 | Clark | |
| 32003000107 | 45.8 | 3 | Clark | |
| 32003003211 | 45.6 | 3 | Clark | |
| 32003002835 | 45.5 | 3 | Clark | |
| 32003003228 | 45.5 | 3 | Clark | |
| 32003005333 | 45.3 | 3 | Clark | |
| 32003005349 | 45.3 | 3 | Clark | |
| 32003005319 | 45.2 | 3 | Clark | |
| 32003003006 | 45.0 | 3 | Clark | |
| 32003003250 | 44.8 | 3 | Clark | |
| 32003002949 | 44.7 | 3 | Clark | |
| 32003006103 | 44.5 | 3 | Clark | |
| 32003002977 | 44.4 | 3 | Clark | |
| 32003002848 | 44.3 | 3 | Clark | |
| 32003003266 | 44.0 | 3 | Clark | |
| 32003005843 | 43.2 | 2 | Clark | |
| 32003005703 | 43.0 | 2 | Clark | |
| 32003005829 | 42.8 | 2 | Clark | |
| 32003005861 | 42.5 | 2 | Clark | |
| 32003005338 | 42.2 | 2 | Clark | |
| 32003005711 | 41.8 | 2 | Clark | |
| 32003003408 | 41.2 | 2 | Clark | |
| 32003005859 | 41.0 | 2 | Clark | |
| 32003002844 | 40.6 | 2 | Clark | |
| 32003005828 | 40.6 | 2 | Clark | |
| 32003003615 | 40.5 | 2 | Clark | |
| 32003005113 | 40.5 | 2 | Clark | |
| 32003003664 | 40.4 | 2 | Clark | |
| 32003003620 | 39.6 | 2 | Clark | |
| 32003005366 | 39.0 | 2 | Clark | |
| 32003006104 | 39.0 | 2 | Clark | |
| 32003005442 | 38.8 | 2 | Clark | |
| 32003005713 | 38.6 | 2 | Clark | |
| 32003005864 | 38.4 | 2 | Clark | |
| 32003001708 | 38.2 | 2 | Clark | |
| 32003005839 | 38.1 | 2 | Clark | |
| 32003005805 | 38.0 | 2 | Clark | |
| 32003003208 | 37.8 | 2 | Clark | |
| 32003005316 | 37.8 | 2 | Clark | |
| 32003005104 | 37.7 | 2 | Clark | |
| 32003003632 | 37.1 | 2 | Clark | |
| 32003005361 | 36.6 | 2 | Clark | |
| 32003002947 | 36.5 | 2 | Clark | |
| 32003002852 | 36.2 | 2 | Clark | |
| 32003003319 | 35.9 | 2 | Clark | |
| 32003003268 | 35.4 | 2 | Clark | |
| 32003005813 | 35.3 | 2 | Clark | |
| 32003002605 | 35.2 | 2 | Clark | |
| 32003002834 | 35.2 | 2 | Clark | |
| 32003000204 | 35.1 | 2 | Clark | |
| 32003005364 | 35.1 | 2 | Clark | |
| 32003002975 | 35.0 | 2 | Clark | |
| 32003003220 | 35.0 | 2 | Clark | |
| 32003002956 | 34.9 | 2 | Clark | |
| 32003005322 | 34.6 | 2 | Clark | |
| 32003003265 | 34.5 | 2 | Clark | |
| 32003003308 | 34.4 | 2 | Clark | |
| 32003005106 | 34.2 | 2 | Clark | |
| 32003005501 | 34.2 | 2 | Clark | |
| 32003002853 | 34.0 | 2 | Clark | |
| 32003003313 | 33.6 | 2 | Clark | |
| 32003005844 | 33.5 | 2 | Clark | |
| 32003005858 | 33.5 | 2 | Clark | |
| 32003005102 | 32.9 | 2 | Clark | |
| 32003005342 | 32.4 | 2 | Clark | |
| 32003005440 | 32.4 | 2 | Clark | |
| 32003005318 | 31.9 | 2 | Clark | |
| 32003002833 | 31.8 | 2 | Clark | |
| 32003003237 | 31.7 | 2 | Clark | |
| 32003005845 | 31.2 | 2 | Clark | |
| 32003002983 | 30.4 | 2 | Clark | |
| 32003003652 | 30.3 | 2 | Clark | |
| 32003005826 | 30.3 | 2 | Clark | |
| 32003002831 | 30.0 | 2 | Clark | |
| 32003003251 | 30.0 | 2 | Clark | |
| 32003005806 | 30.0 | 2 | Clark | |
| 32003003218 | 29.8 | 2 | Clark | |
| 32003002828 | 29.6 | 2 | Clark | |
| 32003003323 | 28.8 | 2 | Clark | |
| 32003002961 | 28.7 | 2 | Clark | |
| 32003003222 | 28.7 | 2 | Clark | |
| 32003005867 | 28.5 | 2 | Clark | |
| 32003005103 | 28.3 | 2 | Clark | |
| 32003003215 | 28.2 | 2 | Clark | |
| 32003003236 | 28.0 | 2 | Clark | |
| 32003005834 | 27.9 | 2 | Clark | |
| 32003003229 | 27.8 | 2 | Clark | |
| 32003005313 | 27.1 | 2 | Clark | |
| 32003002979 | 26.9 | 2 | Clark | |
| 32003005877 | 26.8 | 2 | Clark | |
| 32003005352 | 26.7 | 2 | Clark | |
| 32003002850 | 26.6 | 2 | Clark | |
| 32003005720 | 26.3 | 2 | Clark | |
| 32003005358 | 26.2 | 2 | Clark | |
| 32003002827 | 26.0 | 2 | Clark | |
| 32003005312 | 25.9 | 2 | Clark | |
| 32003005836 | 25.8 | 2 | Clark | |
| 32003005874 | 25.0 | 2 | Clark | |
| 32003006700 | 25.0 | 2 | Clark | |
| 32003005852 | 24.8 | 2 | Clark | |
| 32003003411 | 24.4 | 2 | Clark | |
| 32003003311 | 24.3 | 2 | Clark | |
| 32003005441 | 24.3 | 2 | Clark | |
| 32003005846 | 23.5 | 1 | Clark | |
| 32003005717 | 23.3 | 1 | Clark | |
| 32003004907 | 23.0 | 1 | Clark | |
| 32003005435 | 22.6 | 1 | Clark | |
| 32003005831 | 22.0 | 1 | Clark | |
| 32003003642 | 21.3 | 1 | Clark | |
| 32003002810 | 21.2 | 1 | Clark | |
| 32003002916 | 20.9 | 1 | Clark | |
| 32003003227 | 20.7 | 1 | Clark | |
| 32003003314 | 20.7 | 1 | Clark | |
| 32003005350 | 20.6 | 1 | Clark | |
| 32003002901 | 20.5 | 1 | Clark | |
| 32003005860 | 20.5 | 1 | Clark | |
| 32003002958 | 20.3 | 1 | Clark | |
| 32003003264 | 20.3 | 1 | Clark | |
| 32003005804 | 20.2 | 1 | Clark | |
| 32003003242 | 19.7 | 1 | Clark | |
| 32003005841 | 19.7 | 1 | Clark | |
| 32003002952 | 19.0 | 1 | Clark | |
| 32003005822 | 18.4 | 1 | Clark | |
| 32003005871 | 18.4 | 1 | Clark | |
| 32003003003 | 17.9 | 1 | Clark | |
| 32003003004 | 17.6 | 1 | Clark | |
| 32003002902 | 17.2 | 1 | Clark | |
| 32003003267 | 16.9 | 1 | Clark | |
| 32003005362 | 16.8 | 1 | Clark | |
| 32003002836 | 16.2 | 1 | Clark | |
| 32003005365 | 15.5 | 1 | Clark | |
| 32003003312 | 15.3 | 1 | Clark | |
| 32003002841 | 14.8 | 1 | Clark | |
| 32003005348 | 13.9 | 1 | Clark | |
| 32003003223 | 13.8 | 1 | Clark | |
| 32003003249 | 13.1 | 1 | Clark | |
| 32003005317 | 13.0 | 1 | Clark | |
| 32003003658 | 12.6 | 1 | Clark | |
| 32003005866 | 12.5 | 1 | Clark | |
| 32003003244 | 12.2 | 1 | Clark | |
| 32003003226 | 11.8 | 1 | Clark | |
| 32003003660 | 11.7 | 1 | Clark | |
| 32003005112 | 11.3 | 1 | Clark | |
| 32003005346 | 11.3 | 1 | Clark | |
| 32003005875 | 11.0 | 1 | Clark | |
| 32003003321 | 10.6 | 1 | Clark | |
| 32003005715 | 10.6 | 1 | Clark | |
| 32003005824 | 10.4 | 1 | Clark | |
| 32003005719 | 10.0 | 1 | Clark | |
| 32003003322 | 9.8 | 1 | Clark | |
| 32003005835 | 6.0 | 1 | Clark | |
| 32003002821 | 5.6 | 1 | Clark | |
| 32003005437 | 4.6 | 1 | Clark | |
| 32003005873 | 4.6 | 1 | Clark | |
| 32003005872 | 3.4 | 1 | Clark | |
| 32003003235 | 3.2 | 1 | Clark | |
| 32003005356 | 3.0 | 1 | Clark | |
| 32003005842 | 2.2 | 1 | Clark |
The Health Equity Index is calculated by Conduent Healthy Communities Institute using data from Claritas Pop-Facts®, 2024 and Claritas Consumer Profiles, 2023.
Index values are not comparable across measurement periods. Index values and rankings are specific to a measurement period, showing the relative ranking of a location in comparison to other similar locations at that time.
Every community can be described by various social and economic factors that can contribute to disparities in health outcomes. Conduent HCI's Health Equity Index (formerly SocioNeeds Index) considers validated indicators related to income, poverty, employment, education, language, Medicaid enrollment, and race to identify areas at highest risk for experiencing health inequities.
The national index value (from 0 to 100) is calculated for each zip code and county in the U.S. Communities with the highest index values are estimated to have the highest socioeconomic needs correlated with preventable hospitalizations, premature death, and self-reported poor health and well-being.
Ranks and colors help to identify the relative level of need within a community or service area. The national index value for each location is compared to all other similar locations within the community area to assign a relative rank (from 1 to 5) locally. These ranks are used to color the map and chart for the Health Equity Index, with darker coloring associated with higher relative need.
For example, a zip code with an index value of 50 would be average, as compared with the rest of the country, but an index value of 50 could be high, compared to the values of other zip codes in your selected area.
Map loading has timed out, please check your network connection and try again